
The Four Eras of Liquidity
May 18th 2026
Bottom Line
The four-era framework does show up in market data, and the post-COVID era stands out as the most money-sensitive market period on record, with stocks now responding about three times more strongly to global money supply — the broad measure of money in the economy, including cash, bank deposits, and the credit banks create when they lend — than in earlier eras. Practically, that changes which liquidity measure matters most, which assets tend to move together, and how to read a record high like today's.
Thesis
We began with a basic question: is the four-era framework a real feature of markets, or just a tidy historical story? What we found is that the breaks are real enough to use, and each era carries a distinct pattern in how liquidity and assets interact. The headline finding is simple: markets have become more responsive to the global money supply over time, with the strongest link in era 4, the post-COVID period that began in March 2020. This week, we want to share that map at a high level because it helps explain the current regime.
What Changed
A couple of weeks ago we looked at the shape of the US economy through GDP. This week we shift from economic structure to monetary structure: not what the economy is made of, but the money-supply backdrop that increasingly shapes market behavior.
What changed is that the four-era framework now has direct research backing. We tested it across stocks, bonds, gold, Bitcoin, and home prices, and the relationships clearly changed across eras.
Evidence
The eras are real
We organize modern market history into four eras: pre-1971 when the dollar was still tied to gold, 1971-2008 after Nixon broke that link, 2008-2020 when QE became a defining policy tool, and 2020-present when the COVID response reset the liquidity regime.
We wanted to know whether the data could find those breaks on its own. It largely did. A statistical break-detection routine picked up the 2008 turn in G5 central-bank balance sheets at 2008-10-01 and the 2020 turn at 2020-04-01. Global money supply also identified the 2020 break within 2.6 months.
That tells us the framework is not just a neat narrative. The measurable series bend around the same turning points. Era 1 remains untestable directly because the liquidity data do not reach back far enough.
Money has mattered more in every new era
The clearest high-level finding is that each new monetary era made stocks more responsive to the global money supply. In era 2, a 10% rise in global money supply lined up with about an 11% rise in the S&P 500 on average. In era 3, that became about 21%. In era 4, it became about 30%. That is the progression from 1.09 to 2.12 to 3.05.
Put plainly, the money supply has gone from an important backdrop to a much stronger force inside the equity regime. The fit also stays unusually high across eras, explaining about 88% to 95% of long-run S&P 500 movement depending on the period. Gold and bonds follow the same direction too: their coupling with liquidity also strengthens from era 2 through era 4.
From era 2 to era 4, the S&P 500 became far more sensitive to global money supply growth. Think of it this way: a 10% rise in global money supply lined up with roughly 11% stock gains in the earlier measurable era, about 21% in the QE era, and about 30% in the post-COVID era.
In era 4, the kind of money matters
Consider an analogy: think of money as the water in a swimming pool, and asset prices as the boats floating on top. In era 4, the boats are still being lifted by rising water, but we have to be careful about which waterline we are measuring.
There are two useful layers. Central-bank balance sheets track the money central banks create directly. Broad money supply tracks that base plus deposits, credit creation, and near-cash moving through the wider system. In era 4, those two layers decoupled: central-bank balance sheets shrank under QT while money supply kept expanding.
That distinction helps explain the S&P 500's latest all-time high. On 2026-05-11, SPX reached 7,408. Through the money-supply lens, that high looks supported, with about 88% of the long-run fit explained and the index only slightly below trend. Through the central-bank-balance-sheet lens, the fit is weak and the market looks more stretched. The disagreement is the finding: in era 4, money supply is the more useful liquidity measure.
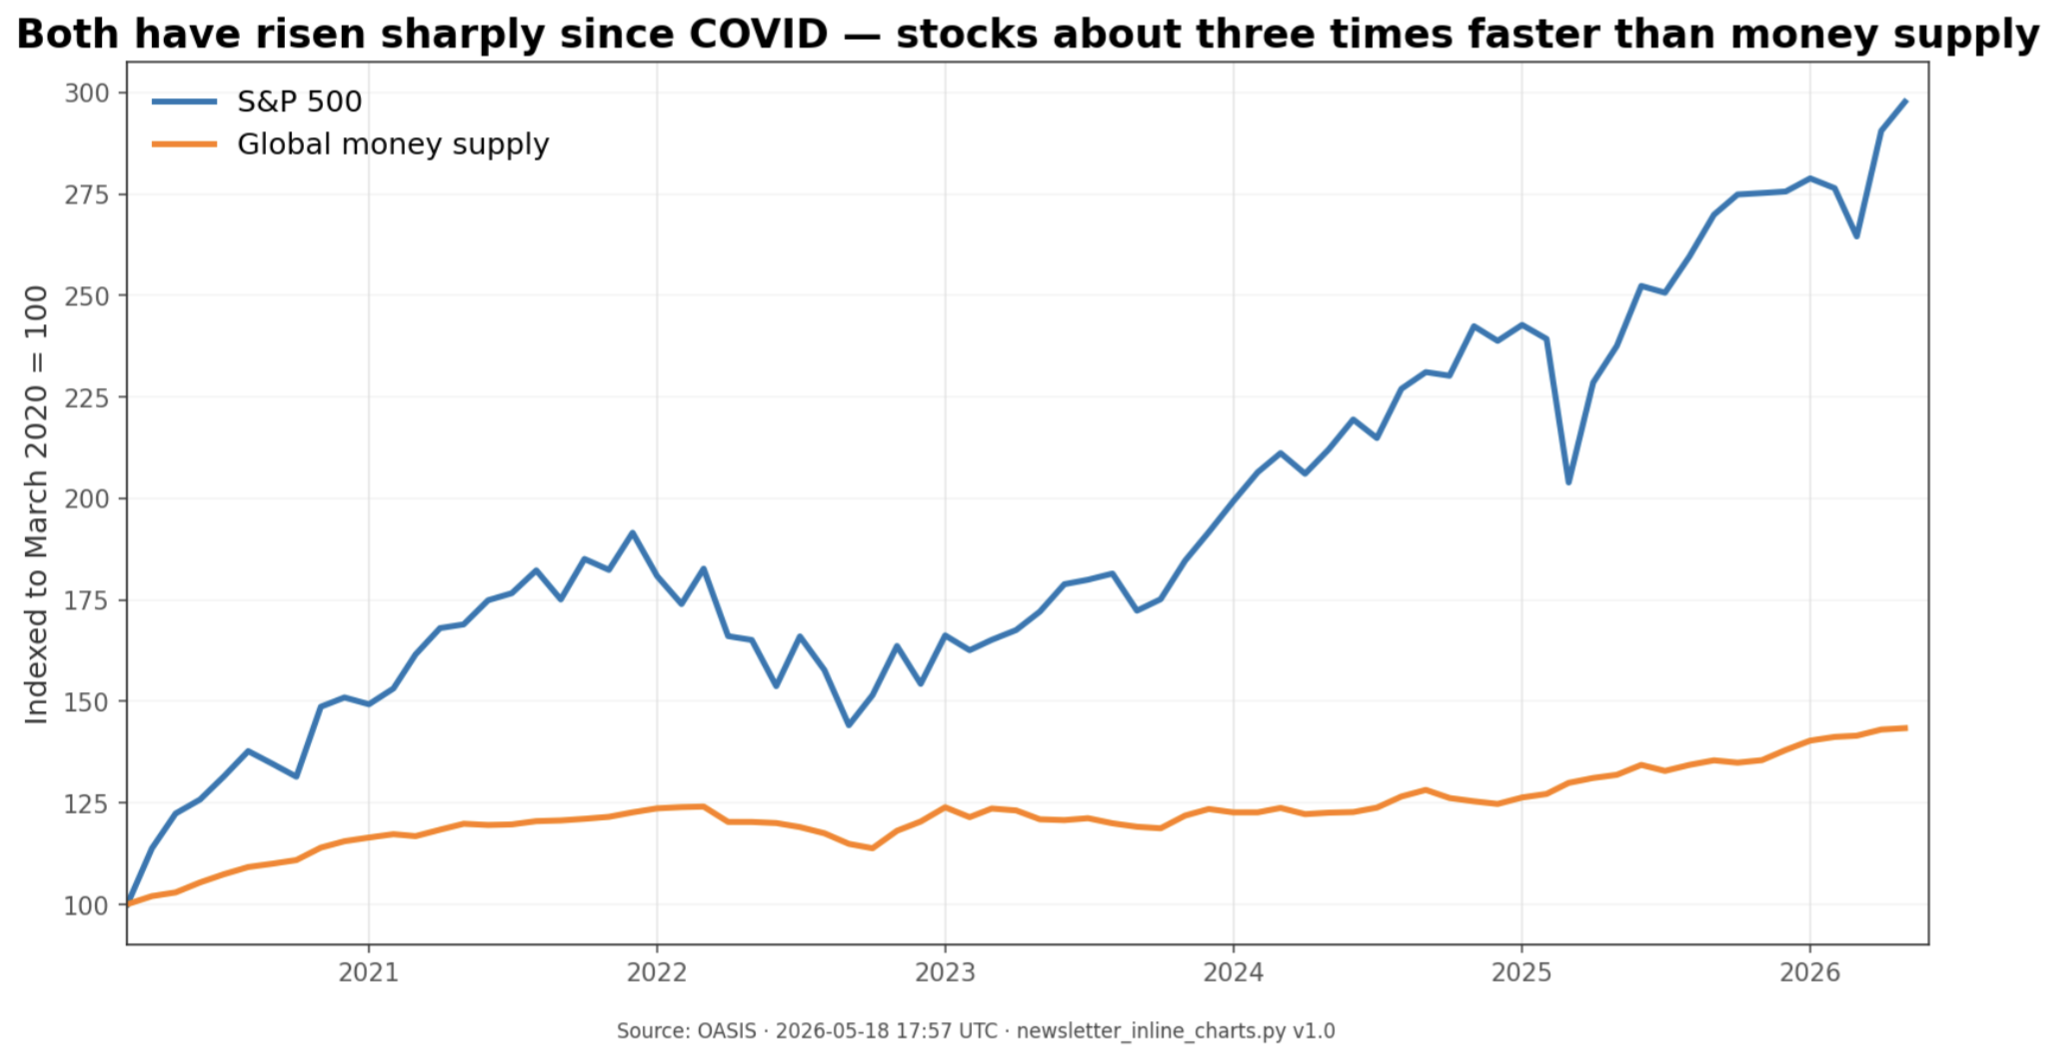
Since March 2020, both global money supply and the S&P 500 have risen sharply. The stock market has risen about three times faster than the money supply over this stretch — which is almost exactly what the era-4 sensitivity (a tripling) would predict. That gap is the elasticity, not a sign of detachment.
Each asset moves on its own clock
Not every asset absorbs liquidity at the same speed. Stocks in era 4 show a real but not overwhelming connection - moving together more often than not with global money supply in the same month (about +0.36). Bonds move on that same clock too, but with a stronger, more reliable monthly connection in price terms (about +0.52).
Bitcoin looks different. At the same-month level it does not show a convincing era-4 link, but with a roughly three-month lag it does. Home prices are slower still: the strongest era-4 link shows central-bank balance sheets leading US home prices by about five months.
That is one of the most useful practical findings from the study. Liquidity matters broadly in this regime, but timing matters almost as much as direction.
Bonds may be the cleanest signal of all
The strongest relationship in the whole matrix was not a price series at all. It was the size of the international bond market relative to global money supply. In era 4, bond-market size and global money supply grew almost in lockstep quarter to quarter, with a correlation of +0.888.
That pattern also carries a clean era fingerprint. In era 2, the BIS bond-market-to-global-money-supply ratio grew about +7.20% per year. In era 3, it fell about -3.10% per year. In era 4, it is growing only about +0.34% per year.
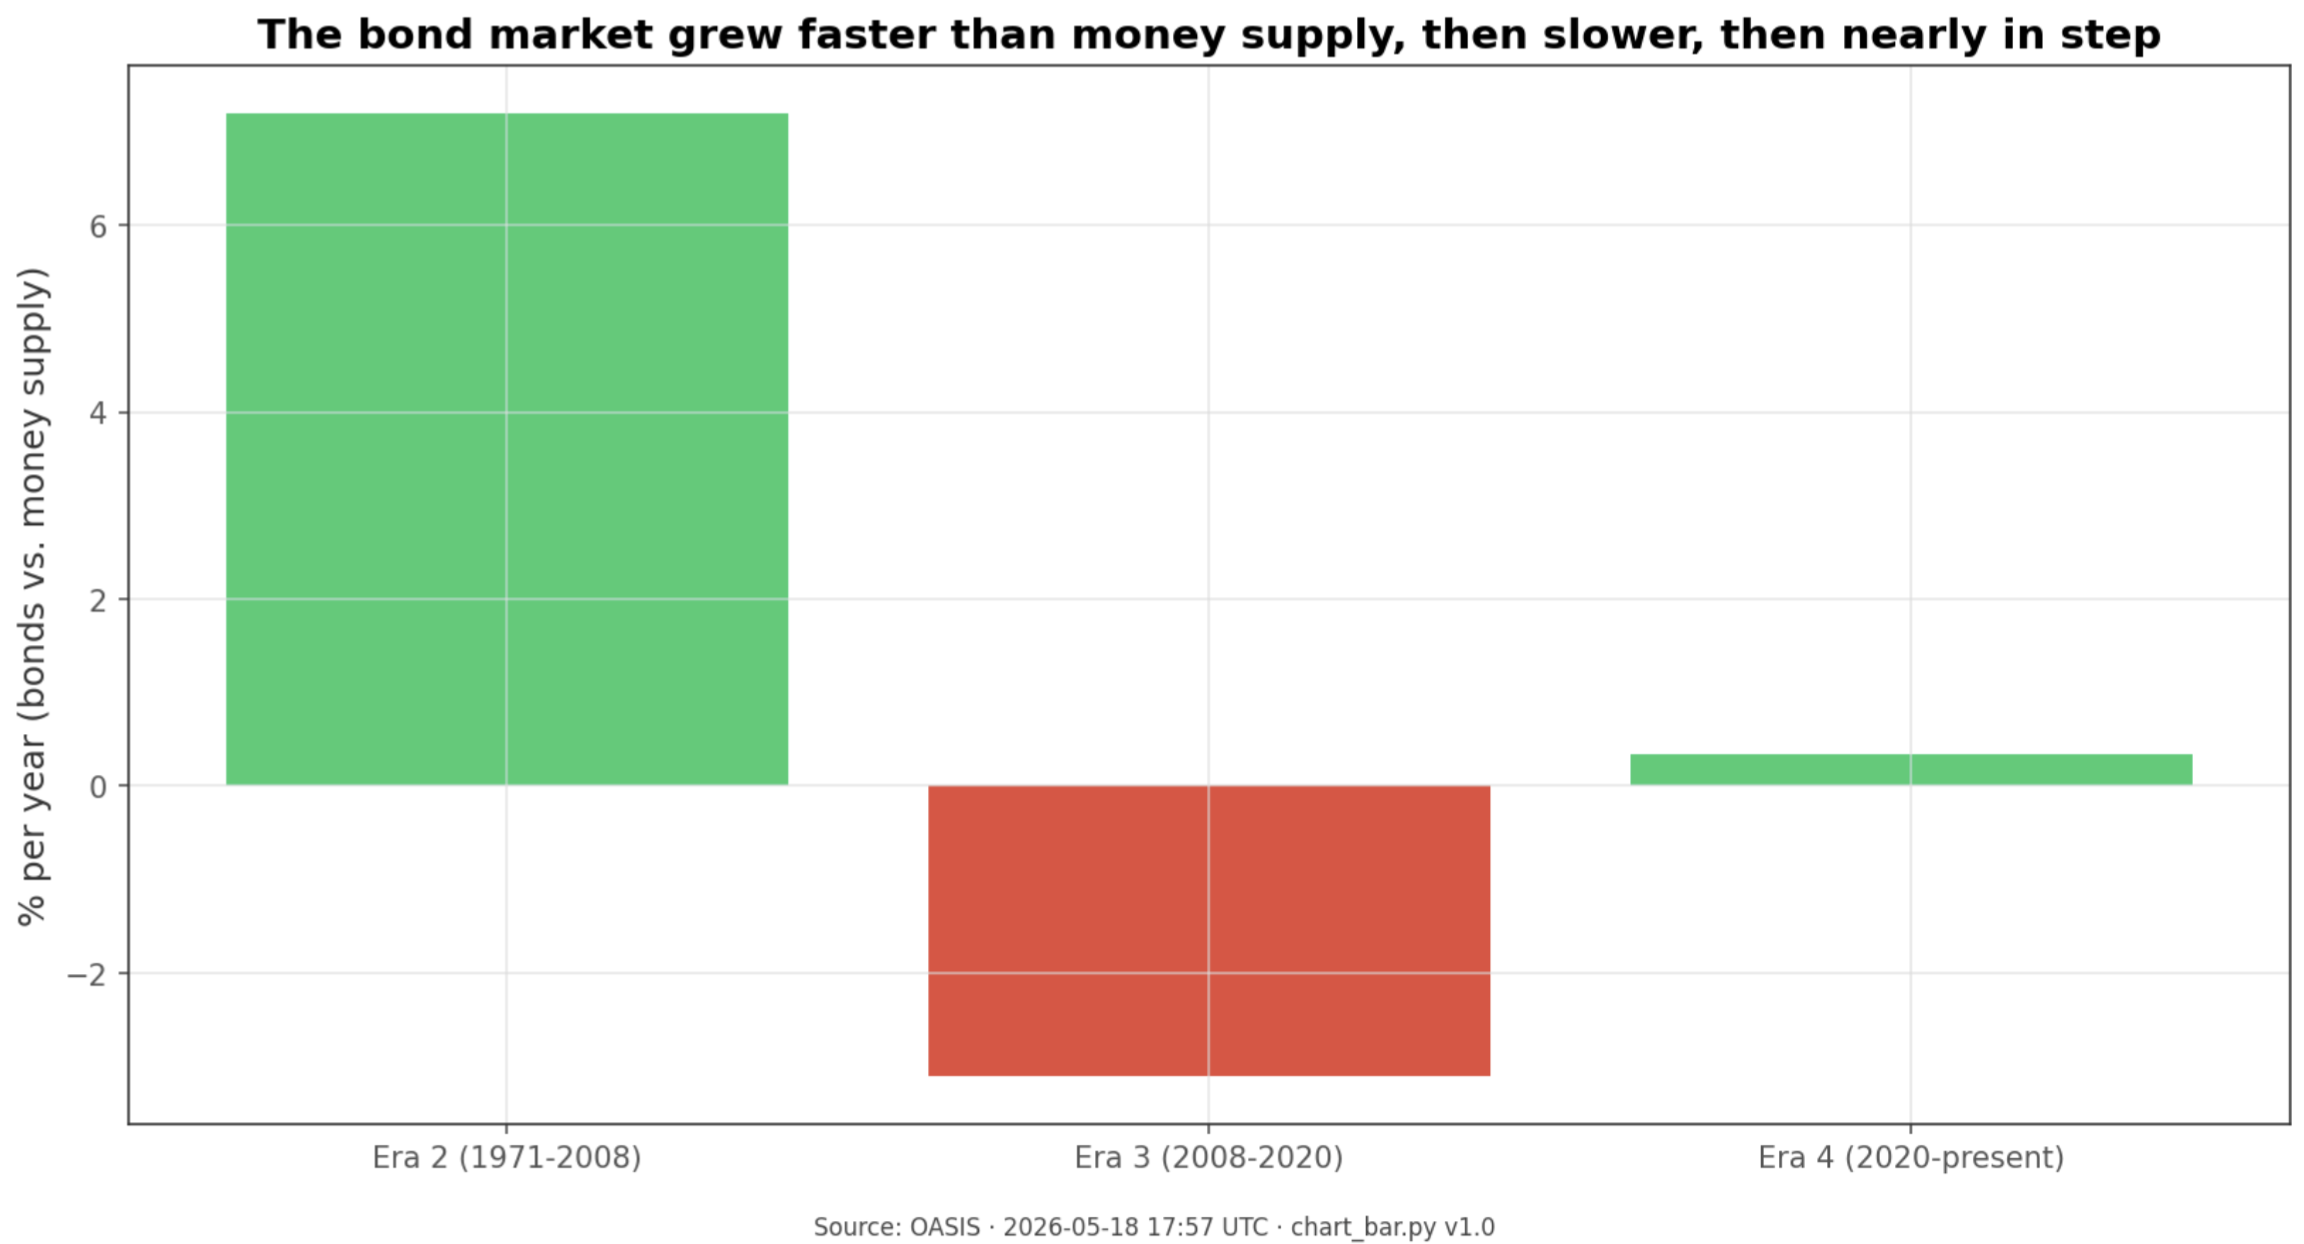
The size of the world bond market grew faster than the money supply in the 1971–2008 era, slower than the money supply during the QE years of 2008–2020, and then almost exactly in step from 2020 onward. Three completely different relationships — one for each era.
What to Watch
Whether the broad money supply keeps rising while central-bank balance sheets stay flat or keep shrinking; if it does, the era-4 decoupling between narrow and broad liquidity remains intact.
Whether new SPX highs continue to arrive alongside a rising global money supply; that would support the view that 7,408 is liquidity-supported rather than detached.
Whether the 12-month momentum in the global money supply keeps pointing to expansion or starts to cool; era 4 asset behavior has been materially different across those regimes.
Whether Bitcoin continues to respond with a delay rather than immediately after liquidity shifts; the three-month lag is the key test of the liquidity-beta story.
Whether bond-market size and the global money supply keep growing in near lockstep; a meaningful break there would be an early sign that the regime itself may be changing.
Look out for next week’s newsletter for further insight into the forces shaping today’s markets.